Cañariaco Norte
A Large Scale Open Pit Copper Project in Peru
- View NI 43-101 Technical Report on Preliminary Economic Assessment | pdf | 10.9 MB
- View Cañariaco Mineral Concessions 2022 | jpg | 963.1 kB
Cañariaco Norte is a 100% owned porphyry copper deposit within a prolific trend of producing mines and known deposits in northern Peru.
Since 2004, Alta Copper has drilled more than 85,000m in 289 drill holes at Cañariaco Norte to define a 9.3B pounds Measured and Indicated Resource, plus 2.7B pounds Inferred Porphyry Copper Deposit, with excellent expansion potential through two nearby, 100% owned porphyry targets, one of which has an initial Inferred Resource of 2.2B pounds of copper, 1.2M ounces of gold and 15.0M ounces of silver. Cañariaco Norte also contains a Measured and Indicated Resource of 2.14M ounces of gold and 59.43M ounces of silver plus an additional Inferred Resource of 0.54M ounces of gold and 18.09M ounces of silver.
In January 2022, a Preliminary Economic Assessment (“PEA”) was completed and returned exceptional economics, with an after-tax Net Present Value (“NPV”) of US$1.01B using the base case US$3.50/lb copper and an 8% discount rate. The NPV increases to US$1.83B when using US$4.50/lb copper.
Cañariaco 2022 PEA Highlights:
- US$1.01B NPV (after tax, 8% discount rate, US$3.50/lb copper)
- US$1.83B NPV (after tax, 8% discount rate, US$4.50/lb copper)
- US$1.04B Preproduction CapEx
- Annual average copper production of 173M pounds (78,543 tonnes) plus 31,395 ounces of gold and 703,588 ounces of silver
- 28 year initial mine life at 40,000 tonnes per day (“tpd”) - potential for extension if additional resources identified below proposed pit can be included in a mine plan
- Expand throughput to 80,000 tpd after Payback (in year 7) with additional CapEx of $305M from Cash Flow
- Operating costs of US$1.28/lb Cu including all on-site and off-site costs, treatment and refining charges, net of by-product credits
- Improved Environmental, Social and Governance (“ESG”) practices results in improved infrastructure design to create smaller overall footprint
- Waste to mineralized material strip ratio of 0.66:1
- Payback of pre-production capital in 7.1 years using base case price of US$3.50/lb copper and 4.5 year using US$4.50/lb copper
- Single Dry Storage Facility with co-disposal of waste rock and filtered mill tailings
- Geometallurgical modelling of the deposit gives a better understanding of the ore body resulting in a very attractive concentrate with no need for arsenic treatment, which dramatically lowers OpEx
- LOM metal production of 4.85B pounds of copper, 879,000 ounces of gold and 19.7M ounces of silver
- Average LOM metal recoveries of 88.1% for copper, 64.7% for gold and 57.2% for silver
- LOM concentrate grades are project to average approximately 26% copper, 3.27 g/t gold and 75.40 g/t silver
- Conventional crush/grind and flotation technology
- Located at a moderate elevation with pit centroid and process plant at approximately 3,000m above sea level
- Connection to the national power grid is planned to be by direct line approximately 55km from the project site
Note: The 2022 PEA mine plan only includes resources from Cañariaco Norte, not the resource estimate recently completed for a portion of Cañariaco Sur, which contains 2.2B pounds of copper, 1.2M ounces of gold and 15.0M ounces of silver.
|
|
NPV Sensitivities (US$M) (after tax) |
||||
|
|
Copper Price US$/lb |
||||
|
|
$3.25 |
$3.50 |
$4.00 |
$4.50 |
$5.00 |
|
6% Discount |
$1,286 |
$1,556 |
$2,092 |
$2,624 |
$3,153 |
|
8% Discount |
$802 |
$1,010 |
$1,423 |
$1,833 |
$2,241 |
|
IRR |
14.8% |
16.3% |
19.2% |
21.9% |
24.4% |
|
Average Annual Cash Flow |
204 |
229 |
278 |
326 |
375 |
|
Payback (Years) |
7.9 |
7.1 |
6.3 |
4.5 |
3.8 |
*All cases with US$1,650/oz gold and US$21.50/oz silver.
Cañariaco Norte Mineral Resource Estimate (0.15% Copper Cut-off Grade)
|
|
|
|
|
|
|
Contained Metal |
||
|
Resource Classification |
tonnes |
Cu Eq (%) |
Cu (%) |
Au |
Ag |
Copper |
Gold |
Silver |
|
Measured |
423.5 |
0.48 |
0.43 |
0.07 |
1.9 |
4.04 |
0.98 |
25.71 |
|
Indicated |
670.7 |
0.39 |
0.36 |
0.05 |
1.6 |
5.25 |
1.16 |
33.72 |
|
Measured+ Indicated |
1,094.2 |
0.42 |
0.39 |
0.06 |
1.7 |
9.29 |
2.14 |
59.43 |
|
Inferred |
410.6 |
0.32 |
0.29 |
0.04 |
1.4 |
2.66 |
0.55 |
18.09 |

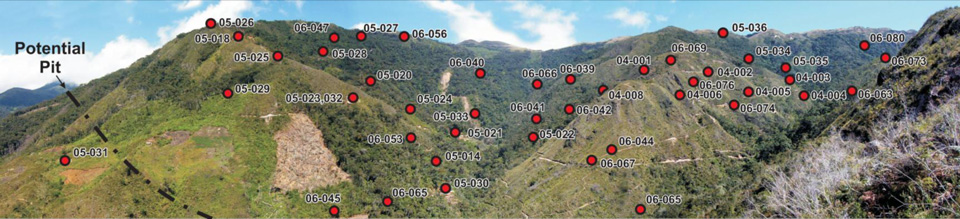
Cañariaco Norte Copper Deposit location map